Difference between revisions of "STM32 FreeRTOS Statistics"
(→Code) |
|||
| (6 intermediate revisions by the same user not shown) | |||
| Line 1: | Line 1: | ||
| − | [[Category:STM32]][[Category:STM32 Development]][[Category:FreeRTOS]]{{metadesc|STM32 FreeRTOS Statistics}} | + | [[Category:STM32]][[Category:STM32 Development]][[Category:FreeRTOS]]{{metadesc|STM32 FreeRTOS Task Statistics}} |
When developing applications which use [[FreeRTOS]] it can be quite unclear how much processing time is actually being used by each task. Fortunately, FreeRTOS have the option of enabling task statistics. | When developing applications which use [[FreeRTOS]] it can be quite unclear how much processing time is actually being used by each task. Fortunately, FreeRTOS have the option of enabling task statistics. | ||
I was at some point messing around with [[DMA]] driven [[PWM]] (see [https://github.com/lbthomsen/blackpill/tree/master/dmapwm here]) on a [[Black Pill]] board. This particular example enables 3 tasks. One task is toggling the built-in LED on PC13. Two other tasks are updating the [[DMA]] buffers triggered by an interrupt call back. | I was at some point messing around with [[DMA]] driven [[PWM]] (see [https://github.com/lbthomsen/blackpill/tree/master/dmapwm here]) on a [[Black Pill]] board. This particular example enables 3 tasks. One task is toggling the built-in LED on PC13. Two other tasks are updating the [[DMA]] buffers triggered by an interrupt call back. | ||
| + | |||
| + | == Tutorial Video == | ||
| + | |||
| + | Watch on Youtube: [https://www.youtube.com/watch?v=zY_I6GZffos https://www.youtube.com/watch?v=zY_I6GZffos] | ||
| + | |||
| + | {{#ev:youtube|zY_I6GZffos}} | ||
== CubeMX Configuration == | == CubeMX Configuration == | ||
| Line 63: | Line 69: | ||
} | } | ||
</pre> | </pre> | ||
| + | |||
| + | That is all that is needed. FreeRTOS will now keep track of these high frequency ticks per task as well as the total ticks counted - which in turn can be used to calculate the percentage for each task. | ||
| + | |||
| + | == Using the statics == | ||
| + | |||
| + | Having enabled the statistics as described in the previous sections, the information becomes available when debugging. Showing the view "FreeRTOS Task List" show the following: | ||
| + | |||
| + | [[File:FreeRTOS Task List.png|800px]] | ||
| + | |||
| + | If using serial debugging we can also create a [https://github.com/lbthomsen/blackpill/blob/13e05cfd1dbdfc1cc67b09c05c67a2a9eaf7d9ec/dmapwm/Core/Src/main.c#L652 task] which print this information: | ||
| + | |||
| + | <pre> | ||
| + | /* USER CODE BEGIN Header_startStatusTask */ | ||
| + | /** | ||
| + | * @brief Function implementing the statusTask thread. | ||
| + | * @param argument: Not used | ||
| + | * @retval None | ||
| + | */ | ||
| + | /* USER CODE END Header_startStatusTask */ | ||
| + | void startStatusTask(void *argument) { | ||
| + | /* USER CODE BEGIN startStatusTask */ | ||
| + | |||
| + | TaskStatus_t *pxTaskStatusArray; | ||
| + | volatile UBaseType_t uxArraySize, x; | ||
| + | unsigned long ulTotalRunTime; | ||
| + | float runtime_percent; | ||
| + | |||
| + | /* Infinite loop */ | ||
| + | for (;;) { | ||
| + | osDelay(10000); | ||
| + | |||
| + | uxArraySize = uxTaskGetNumberOfTasks(); | ||
| + | pxTaskStatusArray = pvPortMalloc(uxArraySize * sizeof(TaskStatus_t)); // a little bit scary! | ||
| + | |||
| + | if (pxTaskStatusArray != NULL) { | ||
| + | uxArraySize = uxTaskGetSystemState(pxTaskStatusArray, uxArraySize, | ||
| + | &ulTotalRunTime); | ||
| + | |||
| + | DBG("Task count = %lu", uxArraySize); | ||
| + | DBG("No Name S Usage HW"); | ||
| + | |||
| + | for (x = 0; x < uxArraySize; x++) { | ||
| + | |||
| + | runtime_percent = (float) (100 | ||
| + | * (float) pxTaskStatusArray[x].ulRunTimeCounter | ||
| + | / (float) ulTotalRunTime); | ||
| + | |||
| + | DBG("Task %lu: %-12s %2d %7.4f %4i", x, | ||
| + | pxTaskStatusArray[x].pcTaskName, | ||
| + | pxTaskStatusArray[x].eCurrentState, runtime_percent, | ||
| + | pxTaskStatusArray[x].usStackHighWaterMark); | ||
| + | |||
| + | } | ||
| + | |||
| + | vPortFree(pxTaskStatusArray); | ||
| + | |||
| + | } else { | ||
| + | DBG("Unable to allocate stack space"); | ||
| + | } | ||
| + | |||
| + | } | ||
| + | |||
| + | /* USER CODE END startStatusTask */ | ||
| + | } | ||
| + | </pre> | ||
| + | |||
| + | This task will result in the following being printed every 10 seconds: | ||
| + | |||
| + | <pre> | ||
| + | Task count = 7 | ||
| + | No Name S Usage HW | ||
| + | Task 0: statusTask 0 0.03 123 | ||
| + | Task 1: IDLE 1 99.96 106 | ||
| + | Task 2: defaultTask 2 0.00 32 | ||
| + | Task 3: ledTask 2 0.00 90 | ||
| + | Task 4: pwmBuf2Task 3 0.00 90 | ||
| + | Task 5: pwmBuf1Task 3 0.00 90 | ||
| + | Task 6: Tmr Svc 2 0.00 215 | ||
| + | </pre> | ||
| + | |||
| + | == Miscellaneous Links == | ||
| + | |||
| + | * [https://community.st.com/t5/stm32-mcus/how-to-enable-freertos-run-time-and-stack-usage-view/ta-p/627524 Blog post from ST] | ||
Latest revision as of 10:18, 14 November 2024
When developing applications which use FreeRTOS it can be quite unclear how much processing time is actually being used by each task. Fortunately, FreeRTOS have the option of enabling task statistics.
I was at some point messing around with DMA driven PWM (see here) on a Black Pill board. This particular example enables 3 tasks. One task is toggling the built-in LED on PC13. Two other tasks are updating the DMA buffers triggered by an interrupt call back.
Tutorial Video
Watch on Youtube: https://www.youtube.com/watch?v=zY_I6GZffos
CubeMX Configuration
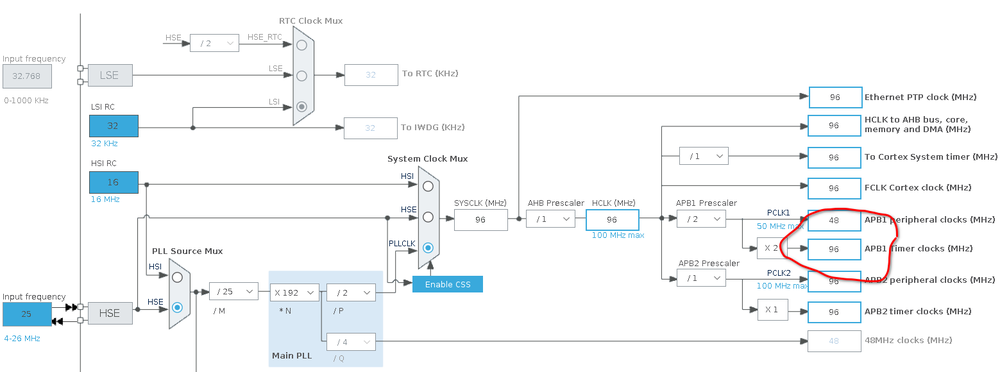
First step is to enable a timer. The clock configuration is like this:
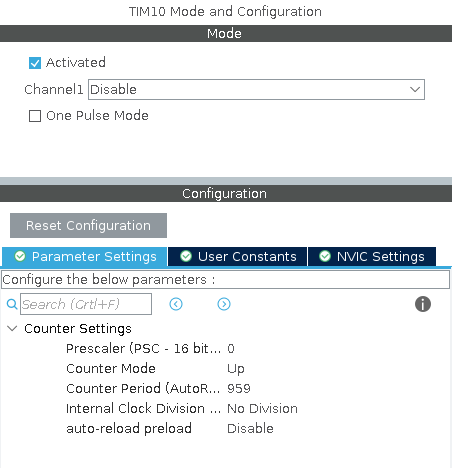
In other words, the APB1 Timer Clock is running at 96 MHz. Configuring the timer with a counter period of 959 and no prescaler will result in an interrupt frequency of 100 kHz - or 100 interrupts every millisecond.
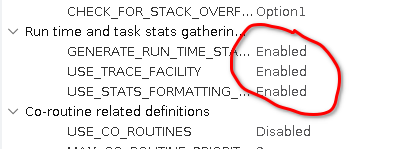
The final step is to enable the statistics in the FreeRTOS section of CubeMX:
Code
Once we have the timer in place and the statistics options enabled in FreeRTOS we need to add a little bit of code.
First step is to add a variable to count the high frequency timer ticks:
volatile unsigned long ulHighFrequencyTimerTicks;
Since the variable is going to get updated in the interrupt handler, we declare it as volatile.
Second step is to update this variable in the interrupt handler itself. In the case of the Black Pill board, which in turn is based on a STM32F411 MCU, the interrupt handler is generated in stm32f4xx_it.c. We simply increment the counter there:
/**
  * @brief This function handles TIM1 trigger and commutation interrupts and TIM11 global interrupt.
  */
void TIM1_TRG_COM_TIM11_IRQHandler(void)
{
  /* USER CODE BEGIN TIM1_TRG_COM_TIM11_IRQn 0 */
  // Needed for freertos stats
  ulHighFrequencyTimerTicks++;
  /* USER CODE END TIM1_TRG_COM_TIM11_IRQn 0 */
  HAL_TIM_IRQHandler(&htim11);
  /* USER CODE BEGIN TIM1_TRG_COM_TIM11_IRQn 1 */

  /* USER CODE END TIM1_TRG_COM_TIM11_IRQn 1 */
}
Enabling the statistics in STM32CubeMX result in a couple of weak functions added to "freertos.c". We can override those functions in our main.c:
void configureTimerForRunTimeStats(void)
{
    ulHighFrequencyTimerTicks = 0;
    HAL_TIM_Base_Start_IT(&htim10);
}

unsigned long getRunTimeCounterValue(void)
{
	return ulHighFrequencyTimerTicks;
}
That is all that is needed. FreeRTOS will now keep track of these high frequency ticks per task as well as the total ticks counted - which in turn can be used to calculate the percentage for each task.
Using the statics
Having enabled the statistics as described in the previous sections, the information becomes available when debugging. Showing the view "FreeRTOS Task List" show the following:
If using serial debugging we can also create a task which print this information:
/* USER CODE BEGIN Header_startStatusTask */
/**
 * @brief Function implementing the statusTask thread.
 * @param argument: Not used
 * @retval None
 */
/* USER CODE END Header_startStatusTask */
void startStatusTask(void *argument) {
	/* USER CODE BEGIN startStatusTask */

	TaskStatus_t *pxTaskStatusArray;
	volatile UBaseType_t uxArraySize, x;
	unsigned long ulTotalRunTime;
	float runtime_percent;

	/* Infinite loop */
	for (;;) {
		osDelay(10000);

		uxArraySize = uxTaskGetNumberOfTasks();
		pxTaskStatusArray = pvPortMalloc(uxArraySize * sizeof(TaskStatus_t)); // a little bit scary!

		if (pxTaskStatusArray != NULL) {
			uxArraySize = uxTaskGetSystemState(pxTaskStatusArray, uxArraySize,
					&ulTotalRunTime);

			DBG("Task count = %lu", uxArraySize);
			DBG("No      Name          S Usage   HW");

			for (x = 0; x < uxArraySize; x++) {

				runtime_percent = (float) (100
						* (float) pxTaskStatusArray[x].ulRunTimeCounter
						/ (float) ulTotalRunTime);

				DBG("Task %lu: %-12s %2d %7.4f %4i", x,
						pxTaskStatusArray[x].pcTaskName,
						pxTaskStatusArray[x].eCurrentState, runtime_percent,
						pxTaskStatusArray[x].usStackHighWaterMark);

			}

			vPortFree(pxTaskStatusArray);

		} else {
			DBG("Unable to allocate stack space");
		}

	}

	/* USER CODE END startStatusTask */
}
This task will result in the following being printed every 10 seconds:
Task count = 7
No      Name          S Usage   HW
Task 0: statusTask    0  0.03  123
Task 1: IDLE          1 99.96  106
Task 2: defaultTask   2  0.00   32
Task 3: ledTask       2  0.00   90
Task 4: pwmBuf2Task   3  0.00   90
Task 5: pwmBuf1Task   3  0.00   90
Task 6: Tmr Svc       2  0.00  215


